Sometimes, just sometimes, I think how it used to be just couple of decades back. Back then, our post-game analysis consisted of huddling around Coach Thompson as he scribbled notes on a wrinkled piece of paper, relying purely on what his experienced eyes had caught during the match. “We need to work on our blocking,” he’d say, or “Your serves were off today, Walker.” It was simple, direct, and based entirely on gut instinct.
During my college years, I witnessed the first hints of change when our coaching staff started tracking basic statistics like kill percentages and error rates. Even those simple numbers opened my eyes to patterns I’d never noticed before. I remember being shocked to discover that my supposedly “consistent” serving actually had significant fluctuations depending on the score situation. That was my first taste of how data could reveal hidden truths about performance.
Now, as someone who’s transitioned from player to coach in the digital age, I’m amazed by how volleyball analytics has transformed the sport. What once required hours of video review and subjective interpretation can now be captured in real-time through advanced tracking systems and statistical analysis. Teams that embrace these tools aren’t just playing the game differently – they’re understanding it at a completely new level.
In this article, we’ll explore how data analytics is revolutionizing volleyball coaching and player development. From serve placement heat maps to rotation efficiency metrics, we’ll dive into the tools and techniques that are giving teams a competitive edge. Whether you’re a coach looking to modernize your approach or a player curious about the numbers behind your performance, you’ll discover how analytics can elevate every aspect of your volleyball game. Let’s serve up some insights into the data-driven future of volleyball!
Data meets volleyball: What has changed?
The game itself hasn’t changed, but how we look at it has. Volleyball analytics involves collecting data on various in-game actions—serves, spikes, digs, blocks, and more. This data is then turned into insights that coaches and players can use to make better decisions.
When I first started seeing laptops on the bench, I’ll admit, I was skeptical. But then I saw the reports—who was the weakest serve receiver, which player struggled under pressure, which zones were being exploited. This wasn’t just stats for the sake of stats, it was clarity.
Here are some ways modern volleyball analytics are changing the game:
1. Serve efficiency
Every coach talks about “serving tough,” but now we can actually measure it. Serve efficiency looks at not just how many aces you got, but whether your serve disrupted the opponent’s formation. For instance, a float serve to Zone 1 might result in a weak pass 70% of the time compared to only 30% when served to Zone 5. That’s information you can use.
Take the 2022 NCAA Women’s Volleyball semi-final between Louisville and Pittsburgh. Louisville targeted Pittsburgh’s libero with deep serves after data revealed she passed with lower accuracy when receiving serves over her right shoulder, and it worked! Pittsburgh’s offence couldn’t build clean plays in the second and third sets, and Louisville gained control.
2. Pass rating systems
Passing is often overlooked because it’s not as flashy as a spike or a block, but analytics brings it into focus. Using a 3-point or 4-point rating system, analysts grade every pass:
- 3 = Perfect pass (all offensive options open)
- 2 = Good pass (limited set of options)
- 1 = Poor pass (only high ball possible)
- 0 = Error (point for opponent)
By charting this over a match or season, you start to see trends. You might realize your best outside hitter is being fed poor-quality balls too often, not because of the setter, but because the pass isn’t good enough in the first place.
3. Heat maps and player movement tracking
Modern tools now track where players move, attack, and defend. Heat maps, a concept borrowed from soccer and basketball, show where most actions are taking place. Are your middle blockers consistently late getting to the pin? Is your opposite hitter attacking from off the net more than 50% of the time? The map tells you.
I remember during one of our club’s training camps, I pulled up a heat map for one of our outside hitters. Turns out, he was leaning so heavily on cross-court swings that the blockers didn’t even need to guess, they were already there waiting. Adjusting this gave him a better hitting percentage in the next tournament.
4 tools that coaches are using today
If you’re picturing massive computers and analysts with lab coats, relax. Many of the tools being used are intuitive and accessible, even if you’re coaching a school team or playing for a local club.
Hudl Assist
Hudl is widely used in volleyball to record matches and break down performance. It is a video analysis and stat tracking software that analyzes your recorded match footage and delivers accurate stats and interactive reports.
Volleyball Rotations

The Volleyball Rotations app makes it easy to learn and show different volleyball formations and movements for each rotation. It covers both offense and defense. You can use the basic 4-2, 5-1, and 6-2 setups, or customize them to match any style you want.
TeamSnap
This is a powerhouse of analytics that every volleyball coach loves. This app simplifies team coordination and communication so that the players understand their positions, movements, and strategies more clearly and quickly. Bonus? It’s so easy to use!
iStatVball 3
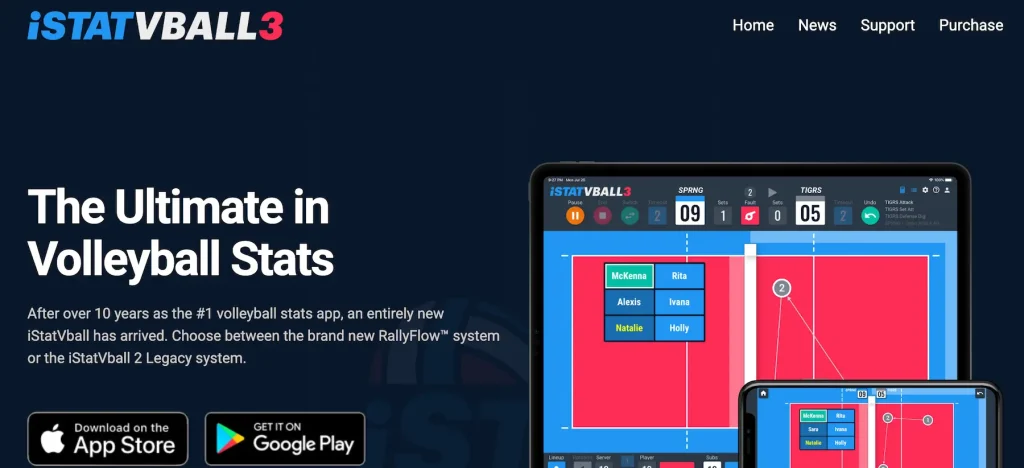
The latest version of iStatVball, iStatVball 3 is ideal for smaller teams and schools. They let coaches record and analyze in real-time using just a tablet without putting any additional effort.
Balancing instinct with insights
Now, here’s where things get interesting. Volleyball is still a game of feel. You can’t always trust numbers alone. There are times when a player’s confidence, momentum, or even crowd energy changes everything. So, how do coaches balance both?
Experienced coaches know that data informs decisions, but it doesn’t make them.
I remember a regional final where our data clearly showed the opposing outside hitter struggled with deep float serves to her right. But after the first set, she adjusted. Her passing improved. The numbers didn’t update fast enough, but our coach noticed. He trusted his instinct, switched to short jump serves, and we gained the upper hand again.
That’s the sweet spot. Let analytics guide you, but don’t forget to watch the game with your eyes.
Why does this matter even if you’re not a pro?
Maybe it sounds a bit much for beginners or casual players. But the important point is that even the most basic analytics can help improve your game.
Here are the things you need to keep in mind:
How often are your serves leading to direct points or poor returns?
Want to improve your serve? Don’t just check if it lands in; look at what happens next. Does it lead to an ace or a weak return? That’s what coaches care about.
A good serve messes with your opponent’s timing, even if it doesn’t score straight away. If your serve keeps them scrambling, you’re doing great. If not, try changing up the placement, power, or spin.
Which zones do you tend to hit into most?
Your hitting patterns matter a lot because they affect your chances of scoring. Whether you’re spiking from the front or back row, knowing where your shots land can change your game.
Most players don’t notice their habits until they see a heat map!
As a coach, I love this because it helps them decide when to change things up or keep playing to their strengths.
Who struggles in your team when receiving short serves?
Short serves are tricky because they can catch you off guard. Some players are excellent with short serves but I have seen many that struggle with it.
When I have the right data, I can evaluate each player’s reflex to short serves. In this way, I can make necessary changes to their positions or player roles.
Conclusion: The future of coaching is smarter, not just louder
Don’t see analytics as a substitute for instinct. See it as a tool to sharpen it. The more you understand the numbers, the more confidently you can rely on your natural feel for the game. Whether you’re a coach on the bench, a player on the rise, or just someone who loves the game, understanding the why behind every point is where the real magic begins.
As someone who’s spent years diving for digs and chasing five-set wins, I can tell you—analytics isn’t killing the soul of volleyball. It’s enhancing it. It’s giving us ways to understand the game better, train more effectively, and compete at higher levels with fewer guesswork.
That’s something every player, coach, and fan should get excited about.
FAQs
1. Can I use analytics even if I’m just a beginner?
Absolutely. Begin with the basics—track how many of your serves land in, how accurate your passes are, and which zones you tend to hit into during games. These may seem like small details, but they give you a clearer picture of your playing habits. For example, if you realise that only half your serves are landing in the court, that’s a signal to work on consistency.
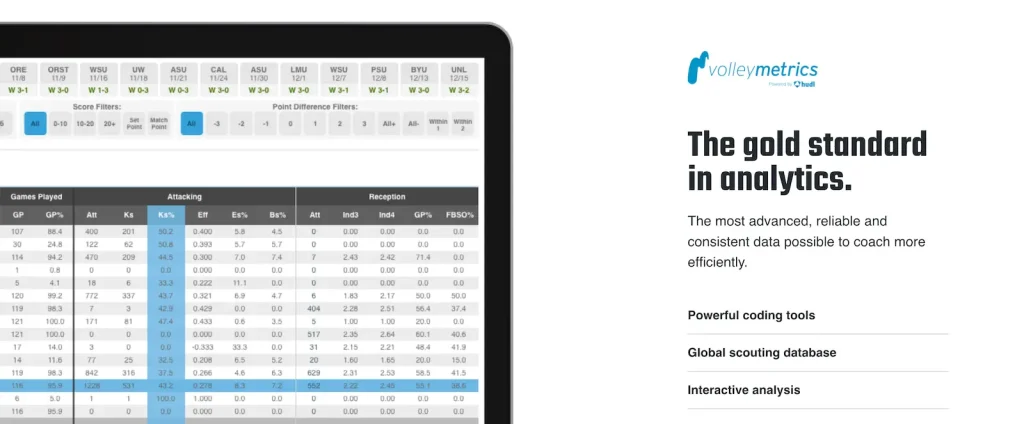
2. What’s the difference between Volleymetrics and Hudl?
Volleymetrics and Hudl both bring powerful data to the court, but they serve slightly different needs.
Volleymetrics is a high-level tool, mostly used by professional teams and college programs. It offers deep, in-depth analysis.
Hudl, on the other hand, is more flexible and widely used at the high school and club levels. It’s user-friendly and makes it easy for coaches and players to review game footage, track key stats, and share insights with the whole team.
3. Do you need a dedicated analyst to use data tools?
You don’t need a data analyst sitting courtside to start using volleyball analytics. Tools like SoloStats and iStatVball are actually designed with coaches and players in mind. They’re simple, intuitive, and can be used in real-time, even during matches. Whether you’re tracking serve accuracy, attack efficiency, or player rotations, these apps make it easy to collect and understand the data on the go.
4. Can analytics help with injury prevention?
Yes. Tracking player movement and fatigue through workload stats can help coaches manage rotations and training loads, reducing overuse injuries. By monitoring things like how far players run, how often they jump, and their overall exertion during matches and practices, coaches can get a detailed look at each player’s workload. This data isn’t just for performance improvement, it’s crucial for managing players’ health and reducing the risk of overuse injuries.